
Product guide · Tools
Activity Feed
Activity Feed is everything that happened across every client site, in one timeline: articles published, audits run, work logged, automation that succeeded or failed. Above the timeline sits AlmaSEO’s workload tracker: retainer hours against budget, whether you’re on pace, which client needs you next, and whether the pace is one you can keep.
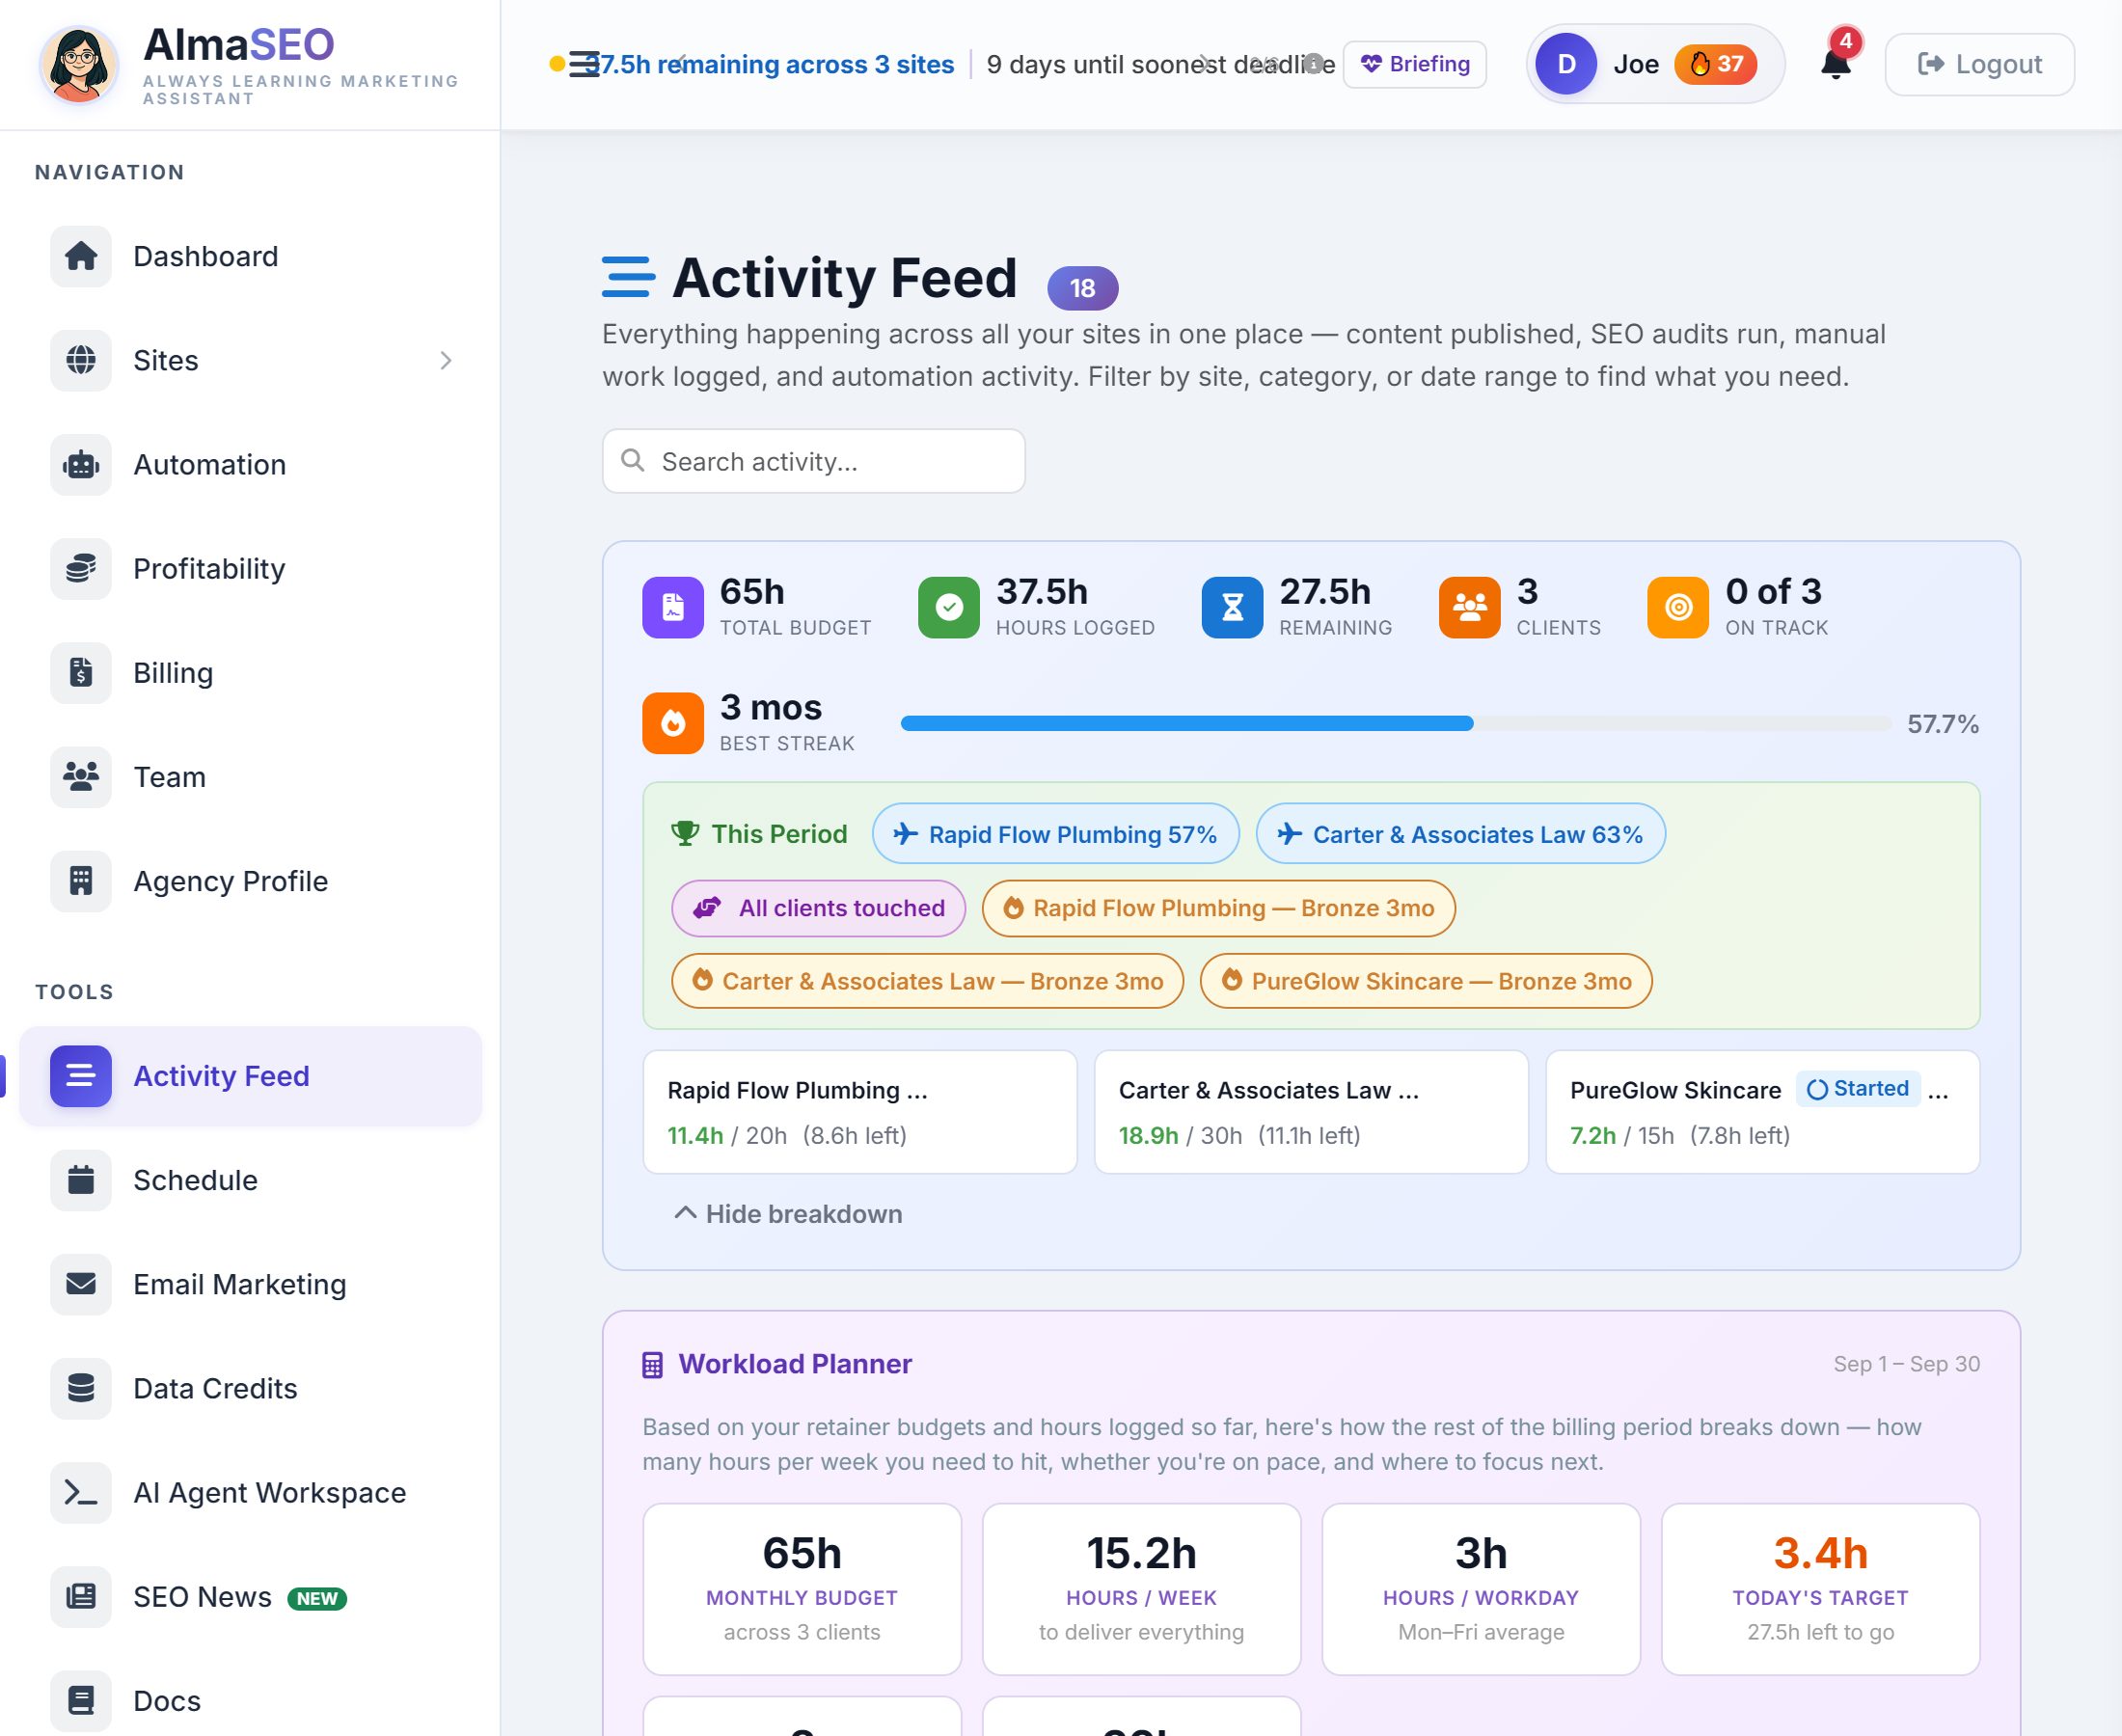
The page reads top to bottom as three questions. How much of this month’s retainer work is done? What does the rest of the month look like, and who is it for? And what actually happened, site by site, day by day? The header’s count is the number of entries in the feed, and the search box on the right searches all of them.
The retainer summary
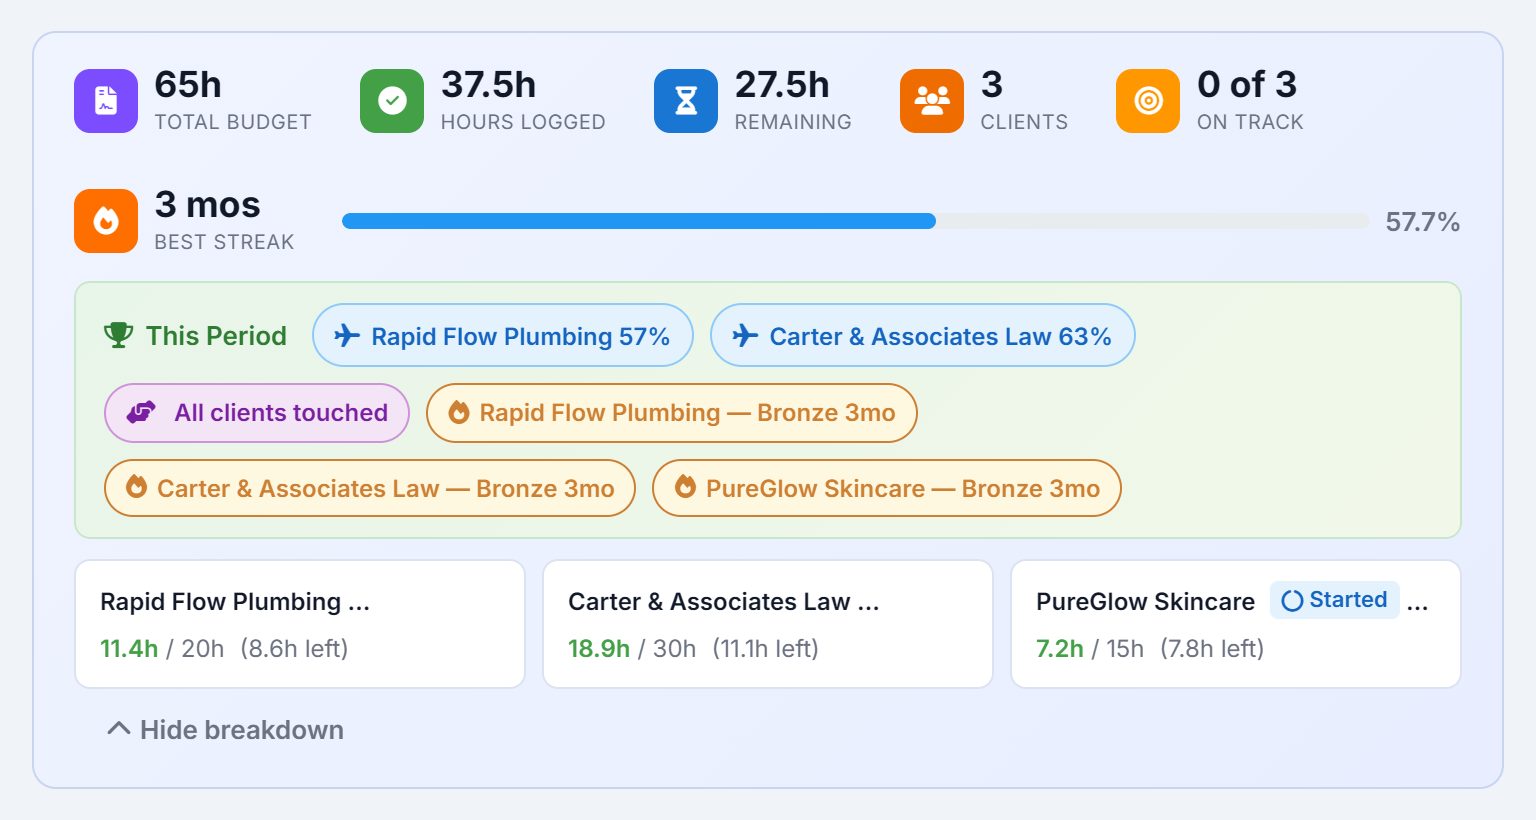
This bar appears once any client has retainer hours set. It adds every client’s current billing period together:
- Total Budget, Hours Logged, Remaining
- The hours your retainers sell this period, the hours logged against them, and what’s left. Remaining turns red when the work runs over.
- Clients
- How many clients have a retainer.
- On Track
- How many of those clients have had at least the hours they were due by this point in the period.
- Best Streak
- The longest run of consecutive periods in which a client got every hour it paid for.
- Progress bar
- All hours logged as a share of all hours sold: green, then blue past half, orange at 85% and red once the portfolio is over.
Under the numbers, This Period collects the wins as chips: a client whose hours are met (with a bolt if it finished early), one that went over, one past halfway, All clients touched, a client’s streak reaching Bronze at three months, Silver at six or Gold at a year, a new personal best for hours, or a record number of clients delivered. When every client’s hours are met, a Perfect Month banner crowns the lot.
Per-client breakdown opens a card for each client: hours logged against its budget, what’s left, its streak, and a badge reading Not Started, Started, 50%+, Met or Over.
Workload Planner
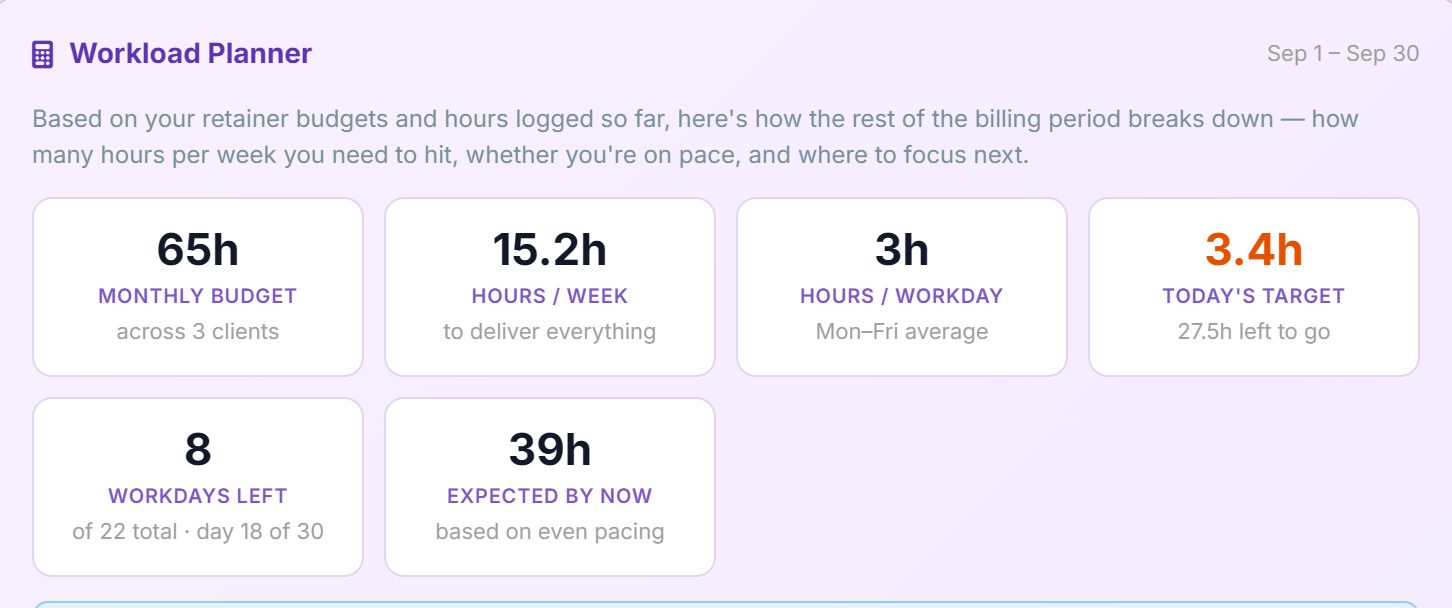
The planner turns the month’s budget into a plan. The dates in its corner are the billing period it covers. The six cards:
- Monthly Budget
- Every client’s retainer hours together.
- Hours / Week and Hours / Workday
- The even pace that delivers it all: per week, and per workday. Workdays are Monday to Friday, minus your company holidays and any booked time off.
- Today’s Target
- The hours left divided by the workdays left. Green while it’s at or under the even pace, orange above it, red when it’s well above.
- Workdays Left
- How many are left of the period’s total, and which day of the period it is.
- Expected by Now
- What you’d have logged by today at an even pace.
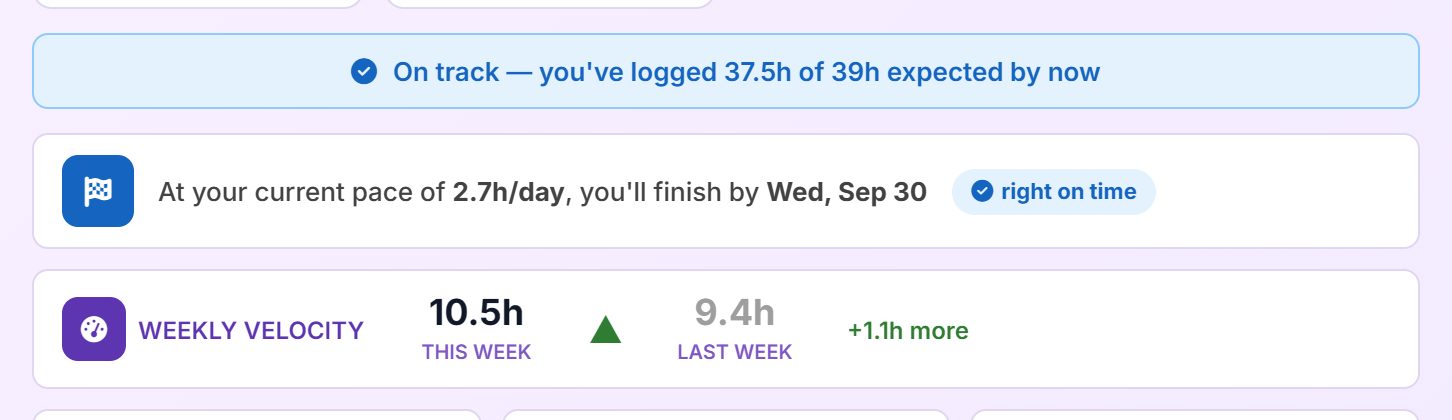
Under the cards, three lines answer “are we OK?”. The pace line compares hours logged with hours expected: within two hours is on track, otherwise it says how far ahead or behind. The projected finish takes your actual hours per workday so far and gives the date you’ll finish at that pace, marked early, right on time or late. Weekly Velocity puts this week’s hours beside last week’s, with an arrow for the direction.

When hours remain, the weekend what-if shows the daily target three ways: weekdays only, adding Saturdays, and adding whole weekends, with how much each would take off every day. It’s there so giving up a Saturday is a decision, not a default.

Daily Work Rhythm is a square for every day of the period, shaded by the hours logged that day, with weekends and today marked. Gaps and heavy stretches show at a glance.
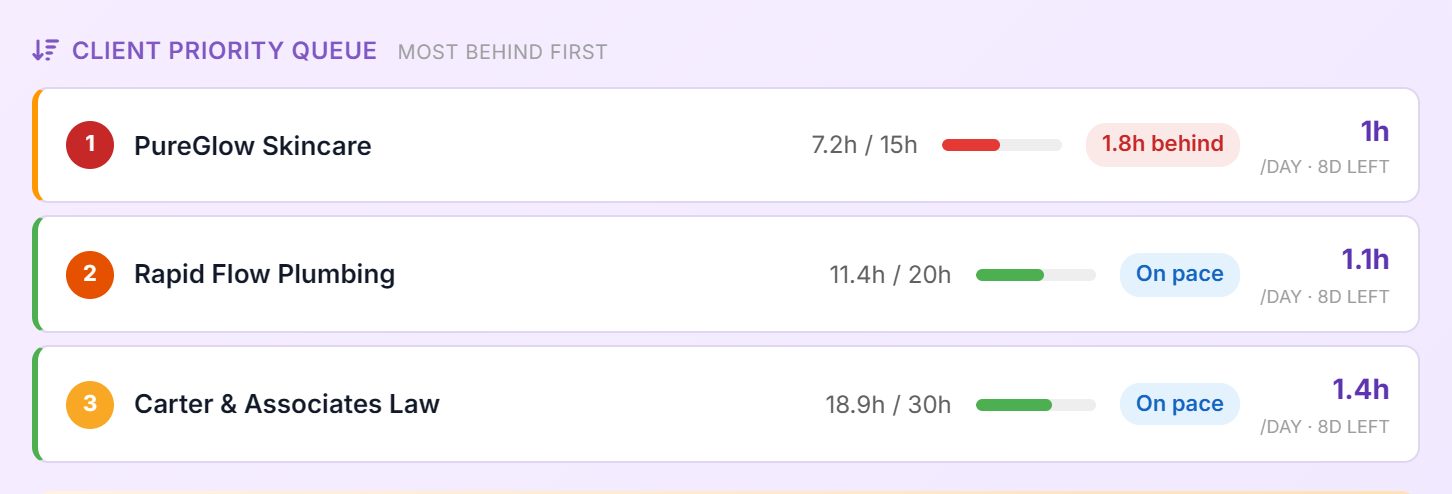
The Client Priority Queue ranks clients by how far behind their own pace they are, most behind first. Each row has the hours logged against the client’s budget, a chip reading behind, on pace, ahead or done, and on the right the hours a day that client needs over its remaining workdays. Start at the top of the list and work down.
Headspace
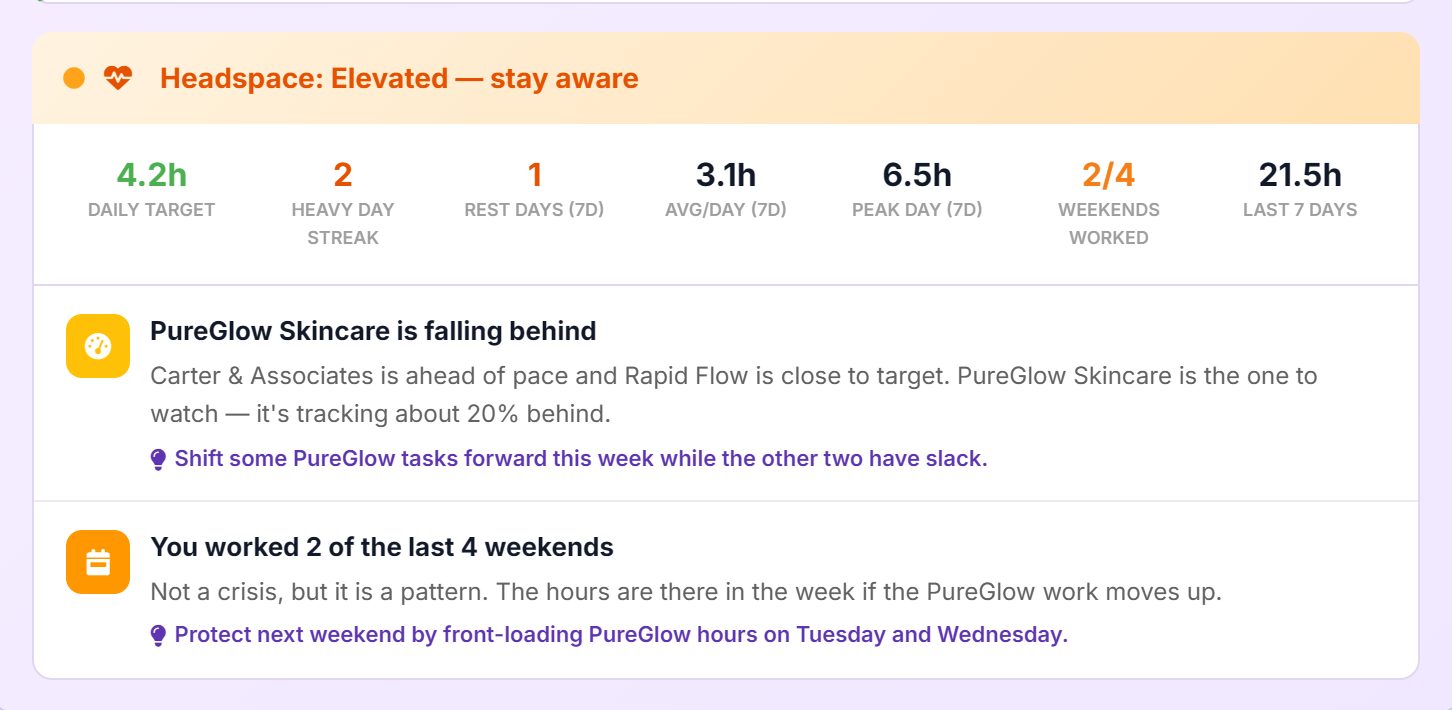
The last part of the planner is a burnout check. Headspace reads the hours behind the plan and gives one of four levels: Healthy, Watch, Elevated or Critical. Seven numbers sit under it:
- Daily Target
- Each client’s hours a day over its own remaining workdays, added together. It can read higher than the planner’s Today’s Target, which spreads all remaining hours evenly.
- Heavy Day Streak
- Consecutive days of eight hours or more.
- Rest Days (7d), Avg/Day (7d), Peak Day (7d)
- The last week: days off, the average day, and the longest.
- Weekends Worked
- Out of the last four.
- Last 7 Days
- Hours logged over the last week.
Below them come the alerts, each with a practical suggestion: a run of 8+ hour days, a catch-up crunch building, a daily target climbing past sustainable, weekends being eaten, no rest day in a week, three weeks of rising hours, an end-of-period squeeze. When nothing is wrong it says so: You’re in a sustainable groove.
The last seven days

Five cards count the last week’s entries by kind: Content, Manual work logged by the team, Automation, SEO, and Errors. The Errors card is the one to watch: anything above zero is worth a look in the timeline below.
Search and filters
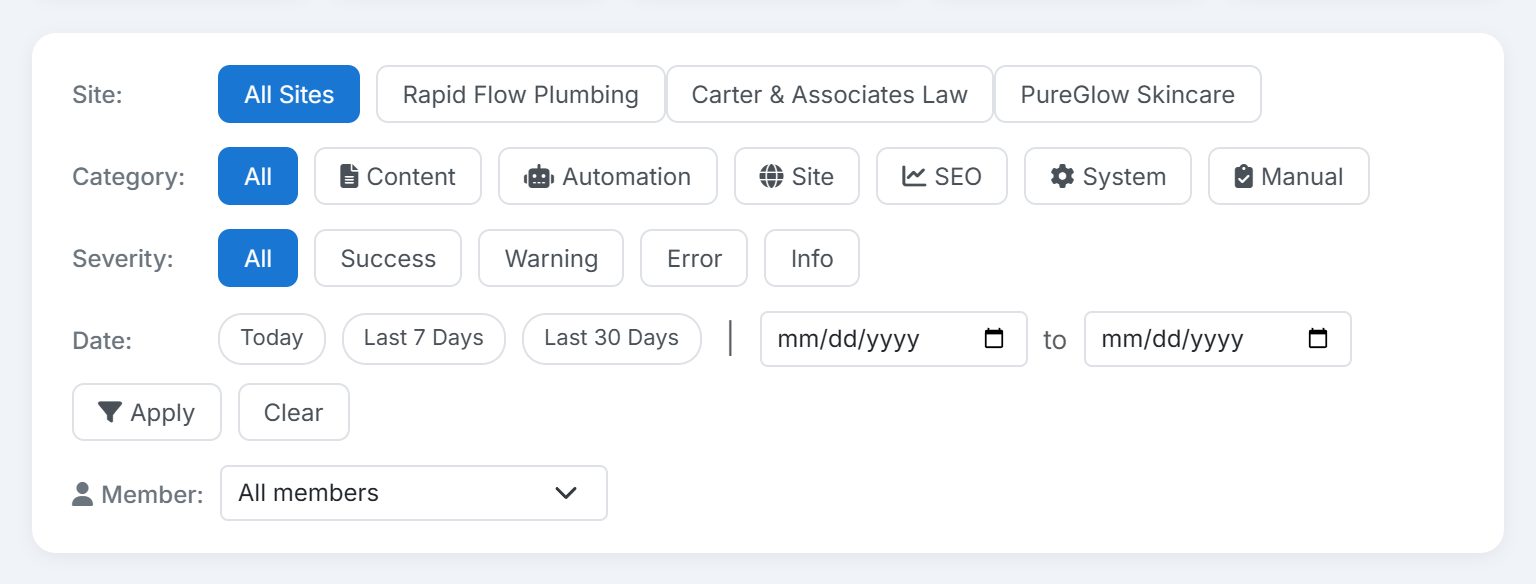
- Site
- All sites, or one client.
- Category
- Content, Automation, Site, SEO, System or Manual.
- Severity
- Success, Warning, Error or Info.
- Date
- Today, the last 7 or 30 days, or any range you pick.
- Member
- On a team of two or more, one person’s activity.
Filters combine with each other and with the search box, so “errors on one client this week” is three clicks. The line under the panel says when the feed was last loaded, and the arrow beside it reloads it.
The timeline
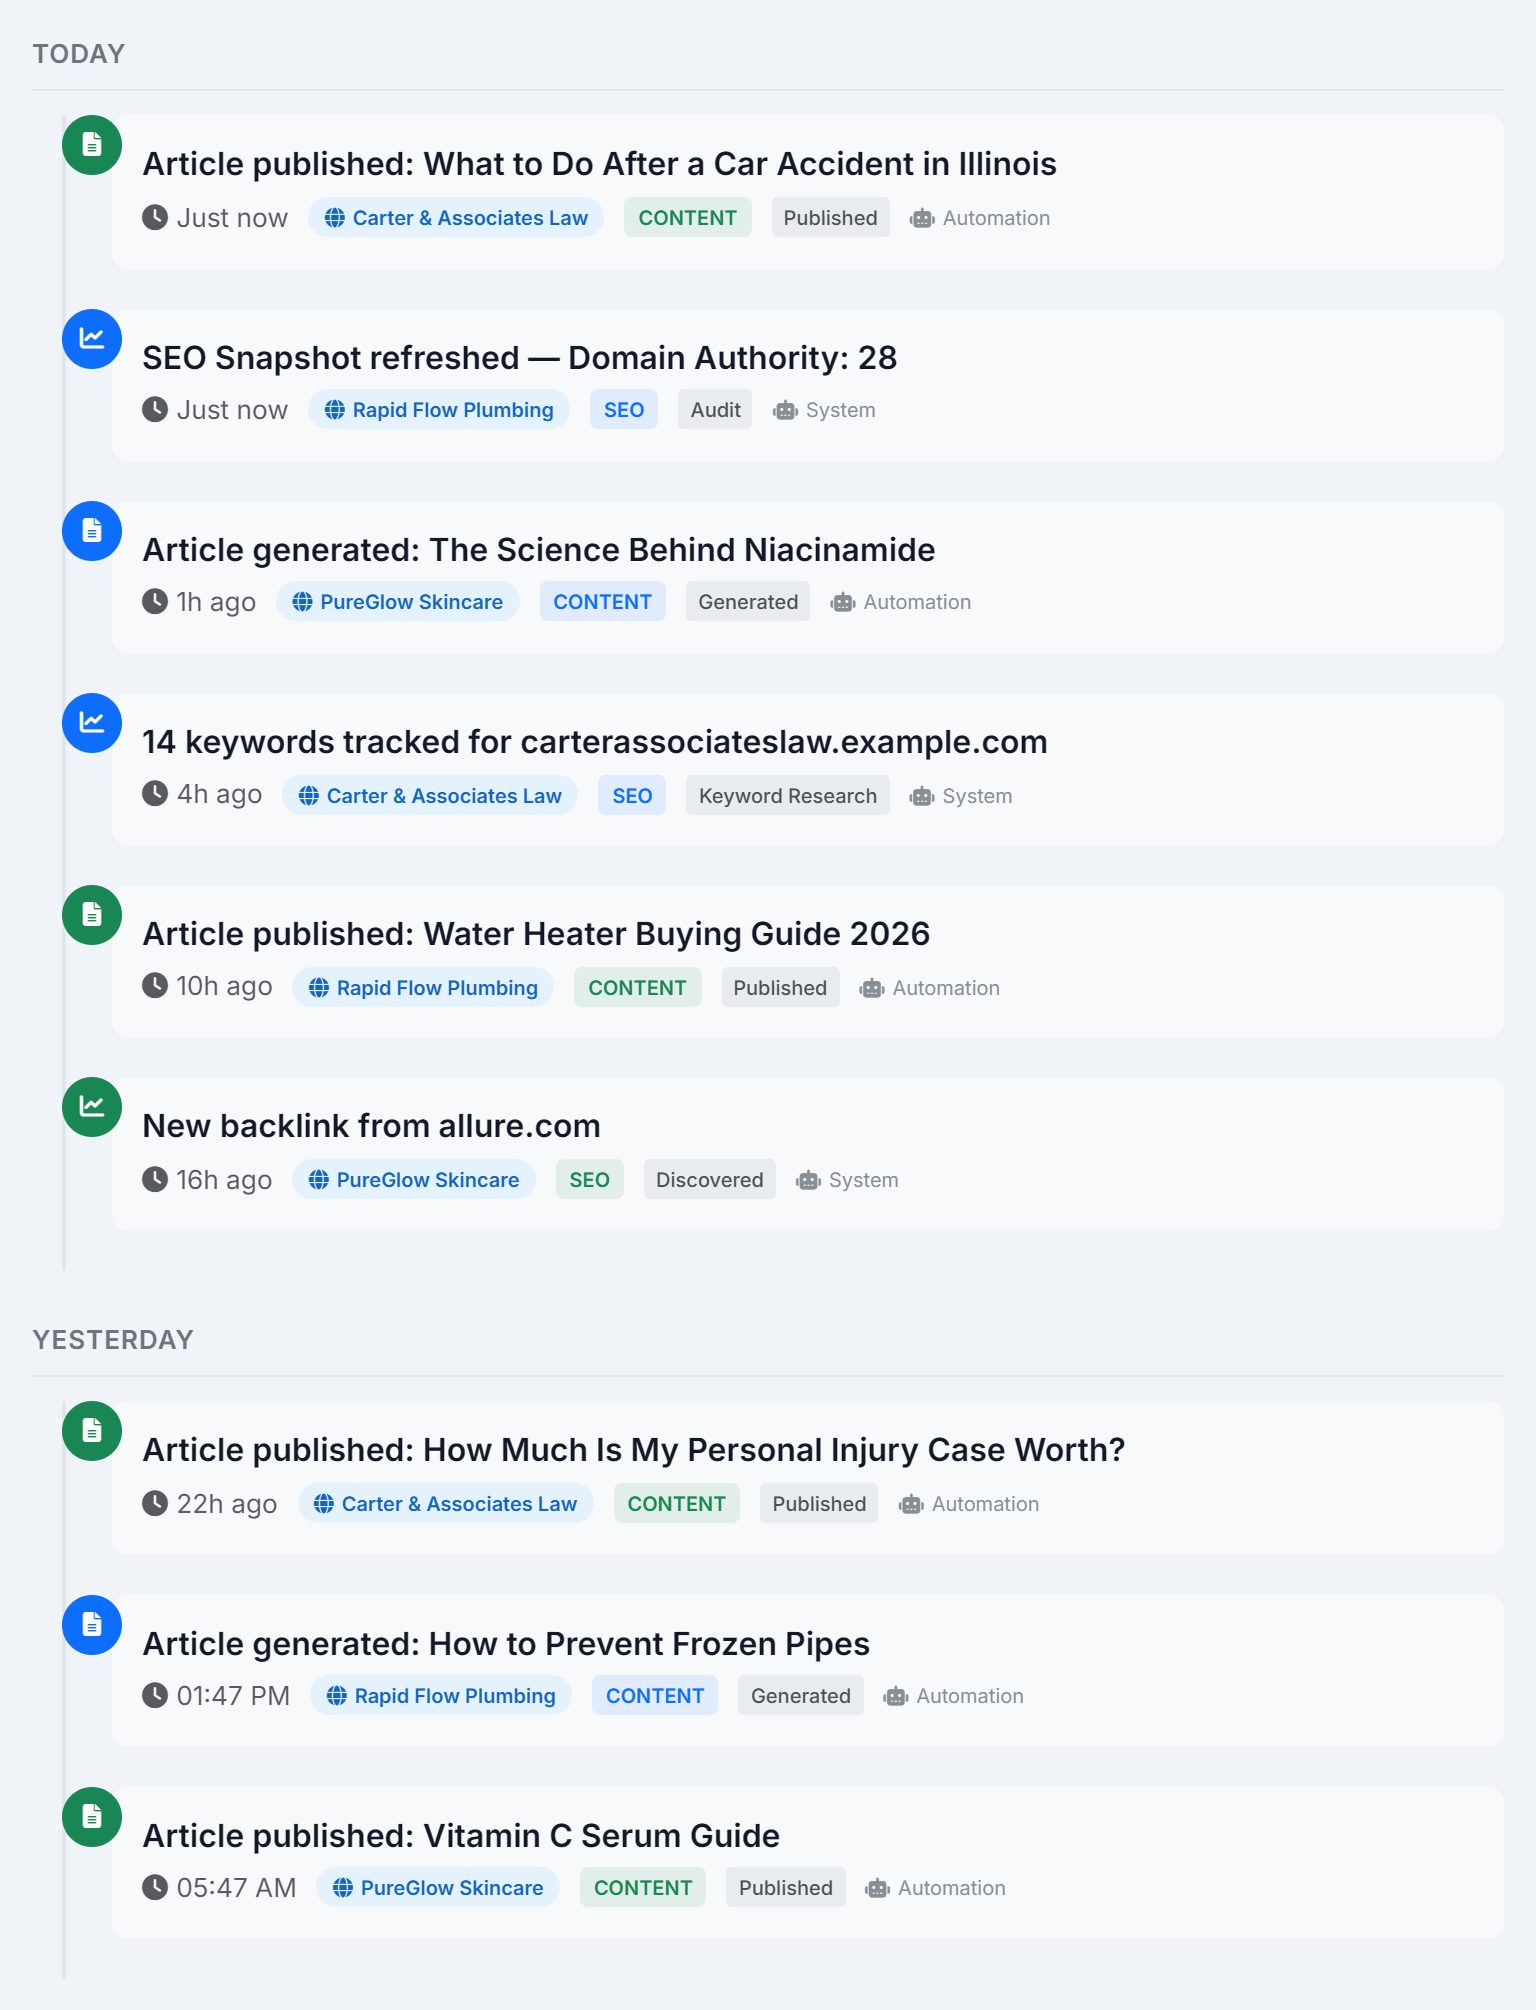
The feed itself, newest first and grouped by day, fifty entries at a time with Load More at the bottom. Each entry carries:
- Icon
- What kind of activity it is, coloured by how it went: success, warning, error or info. Manual work shows the icon for its work type.
- Title and description
- What happened. An article’s title opens the article.
- Time and site
- When, and for which client.
- Category and action
- The kind of work and the step: published, generated, completed, failed.
- Duration
- On timed work, how long it took.
- Source
- Where it came from when it wasn’t a person: Alma Chat, Automation or System.