
Why this matters
When you manage one website, you can keep it all in your head. When you manage ten, something always slips: a client's site gets slow and nobody notices, a task goes overdue, or a retainer quietly eats twice the hours it pays for.
The Dashboard exists to catch those things before your client does. It's the first screen you see every time you sign in, and it answers three questions across every site at once:
- What's due? (Strategy tasks banner)
- Is the business healthy? (Business Overview)
- Is any site in trouble? (Portfolio Web Vitals)
Then it gives you a card for every site so you can jump in.
The SEO concept: Core Web Vitals
Core Web Vitals are Google's three measurements of how a page feels to a real visitor:
| Metric | What it measures | Good | Needs work | Poor |
|---|---|---|---|---|
| MetricLCP (Largest Contentful Paint) | What it measuresHow long until the main content shows up | Good2.5s or less | Needs workup to 4s | Poorover 4s |
| MetricCLS (Cumulative Layout Shift) | What it measuresHow much the page jumps around while loading | Good0.1 or less | Needs workup to 0.25 | Poorover 0.25 |
| MetricINP (Interaction to Next Paint) | What it measuresHow fast the page reacts when you tap or click | Good200ms or less | Needs workup to 500ms | Poorover 500ms |
How much do they matter for rankings? Honestly, a little. Google uses them as a ranking signal, but great content on a slow page will usually beat thin content on a fast one. Where they really matter is people: slow, jumpy pages lose visitors and leads. For a local service business, that's lost phone calls. Fixing them is technical SEO work, and each site has its own Technical SEO tab for exactly that.
Lab data vs field data (the part most people get wrong)
Speed gets measured two different ways, and the Dashboard shows both:
- Lab data is a simulated test: one visit, on a pretend mid-range phone, from one location. It produces the 0–100 performance score. It's great for finding problems and checking fixes.
- Field data is what real visitors actually experienced, collected by Google from Chrome users over the past 28 days. This is what Google uses for rankings.
Why it matters:
- A site can score 55 and still pass Core Web Vitals, because real visitors on real devices have a fine experience. It can also score 95 and fail.
- INP only exists in field data. A lab test can't click around like a person.
- Small sites with little traffic often have no field data at all, because Google doesn't have enough visits to report on. In that case, the lab score is the best signal you have.
When a client panics about a low score, check the field numbers first. That one habit will save you a lot of unnecessary work.
The agency angle: sites rarely get slow all at once. A new plugin, an oversized hero image, or a chat widget gets added, and the score slides. Catching the drop the week it happens makes the fix obvious. Catching it three months later means digging through everything that changed.
The business concept: your real hourly rate
Every retainer is a bet: "I'll do this client's work in X hours for $Y." Your effective hourly rate tells you whether the bet is paying off:
Effective rate = monthly fee ÷ hours actually worked
A $1,500/month client budgeted at 15 hours is worth $100/hr on paper. If that client actually takes 25 hours, you're earning $60/hr, and you won't feel it until you're burned out. Utilization (hours worked ÷ hours budgeted) is the early warning. Profitability is the lesson that takes this apart client by client.
Walkthrough: the Dashboard, top to bottom
Where: Dashboard, at the top of the left sidebar. It's also the page AlmaSEO opens on every time you sign in.
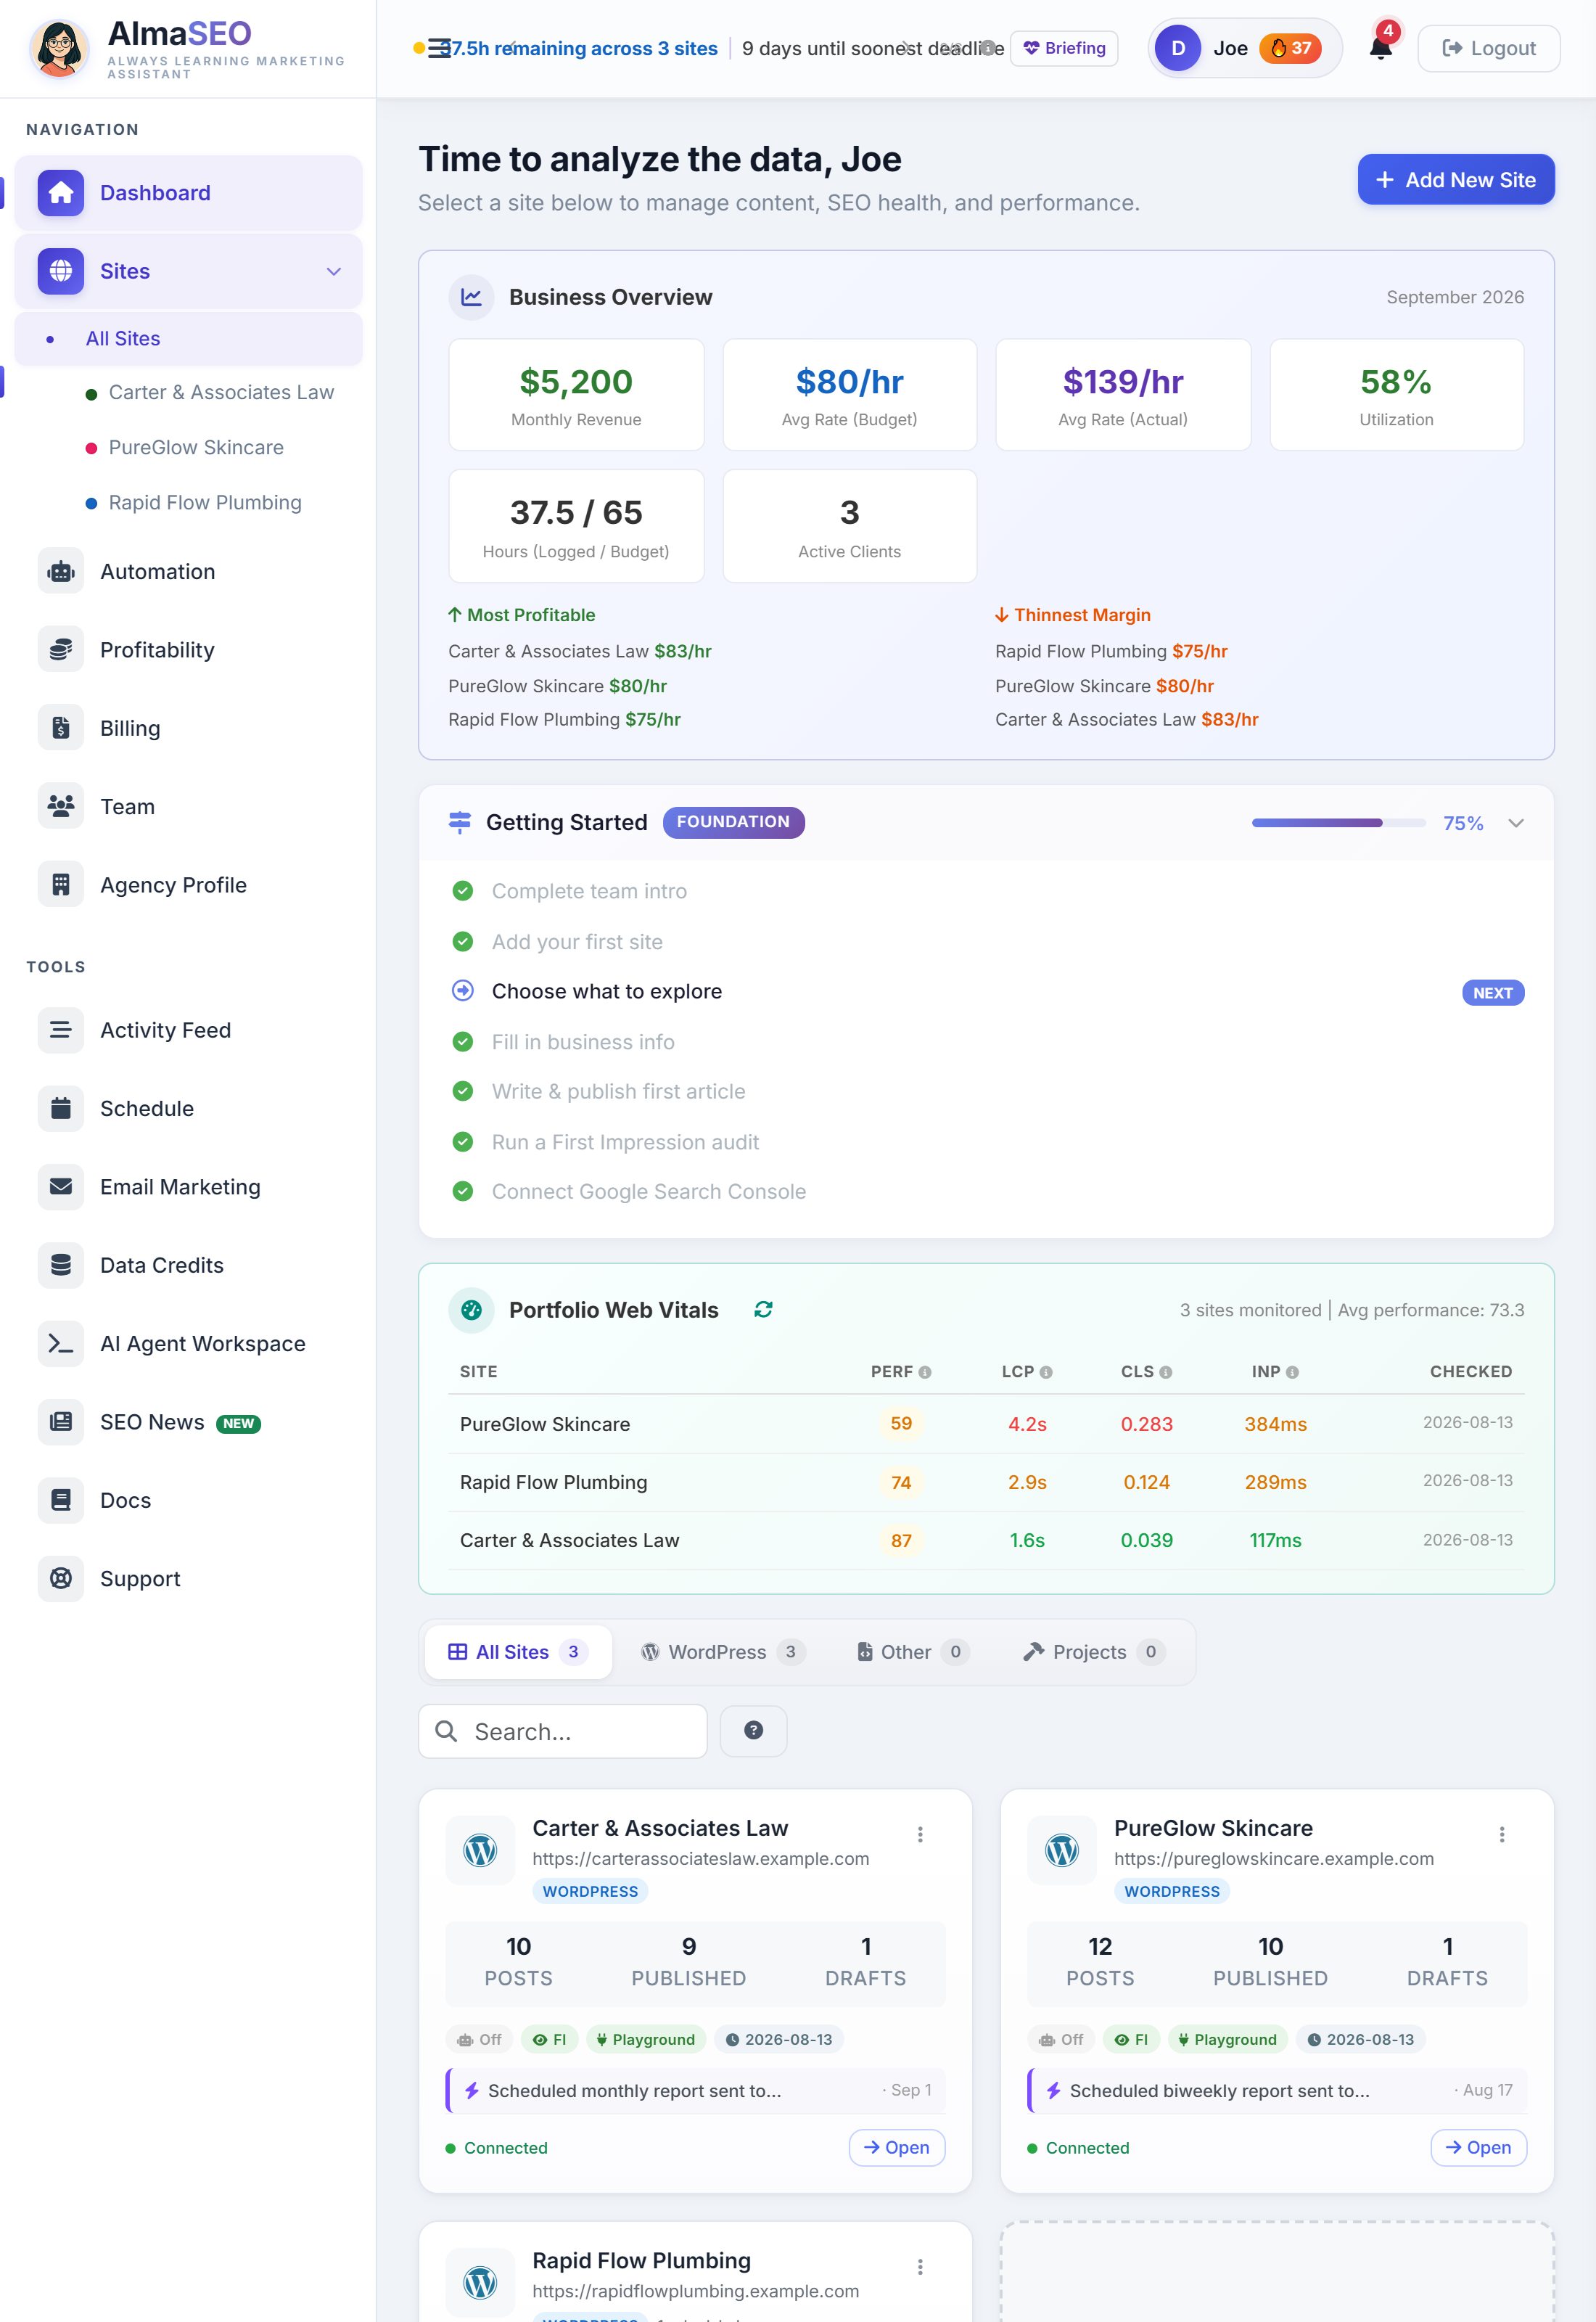
Panels only appear when they have something to say. A brand-new account sees none of them, just an invitation to add a first site. Every field below is documented field by field in the Dashboard page of the product guide; this lesson is about what to do with them.
1. Strategy tasks due this week
A banner at the very top, such as "4 strategy tasks due this week (1 overdue)." It's the only place in AlmaSEO that totals strategy tasks across every site.
- Click it to expand: each site, how many tasks are due and overdue, and the task titles.
- View tasks → opens that site's Project Tasks tab, where the work gets done.
- No banner means nothing is due. That's intentional.
2. Business Overview (Agency plan)
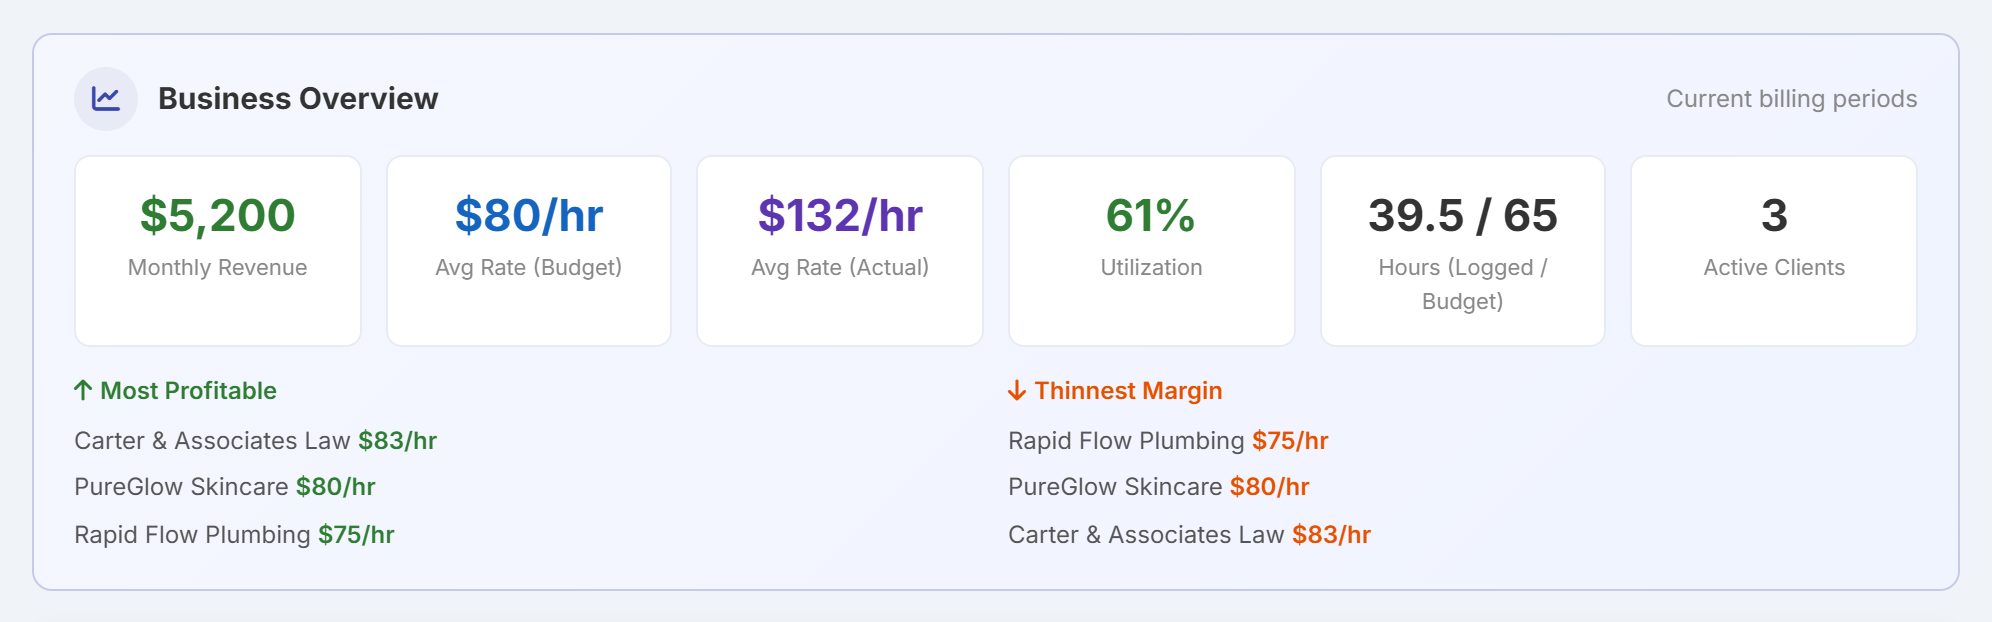
On the Agency plan, and shown to the account owner and managers only. Analysts and viewers never see it, since it shows what every client pays. Six numbers, measured over each client's current billing period (from its billing day, or the calendar month if none is set):
- Monthly Revenue: all retainer fees combined
- Avg Rate (Budget): revenue ÷ hours you sold
- Avg Rate (Actual): revenue ÷ hours logged so far this period. It starts high and falls as the period goes on.
- Utilization: hours logged as a % of hours budgeted
- Hours (Logged / Budget)
- Active Clients: sites with a Monthly Fee set
Below them, Most Profitable and Thinnest Margin list your top and bottom three clients. If any client has gone over its hours, a warning shows how much revenue is at risk.
Where the numbers come from: each site's Retainer Tracker (Monthly Fee, Monthly Hours and Billing Day, on the Activity/Logs/Reports tab) plus the hours logged against that site. These are the same numbers the Profitability page uses, so the two always agree.
3. Getting Started checklist
Your account setup, in the fastest order to a working site. AlmaSEO checks items off by itself as you do them.
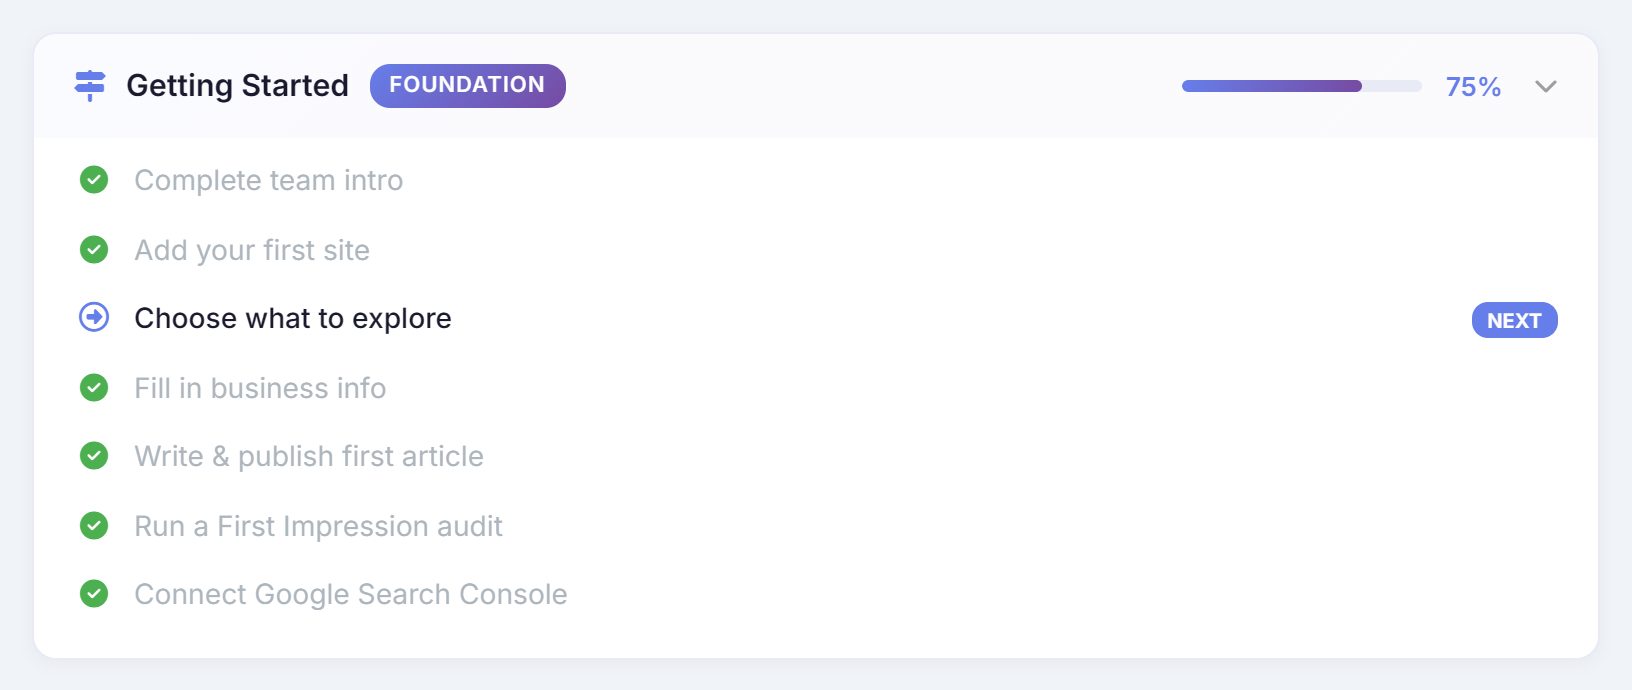
| Phase | Milestones |
|---|---|
| Foundation | Complete team intro · Add your first site · Choose what to explore · Fill in business info |
| First Value | Write & publish first article · Run a First Impression audit · Connect Google Search Console |
| Power Features | Set up content automation · Log your first work entry · Upload your logo |
| Stickiness | Publish 5+ articles · Connect Google Analytics |
Connect Google Search Console early. Several features inside each site stay empty until it's connected — Sites is the lesson that walks through it.
The checklist leaves the Dashboard for good once you reach the Stickiness phase, even if those last two milestones are still open.
4. Portfolio Web Vitals
One row per site: performance score, LCP, CLS, INP, and the date checked.
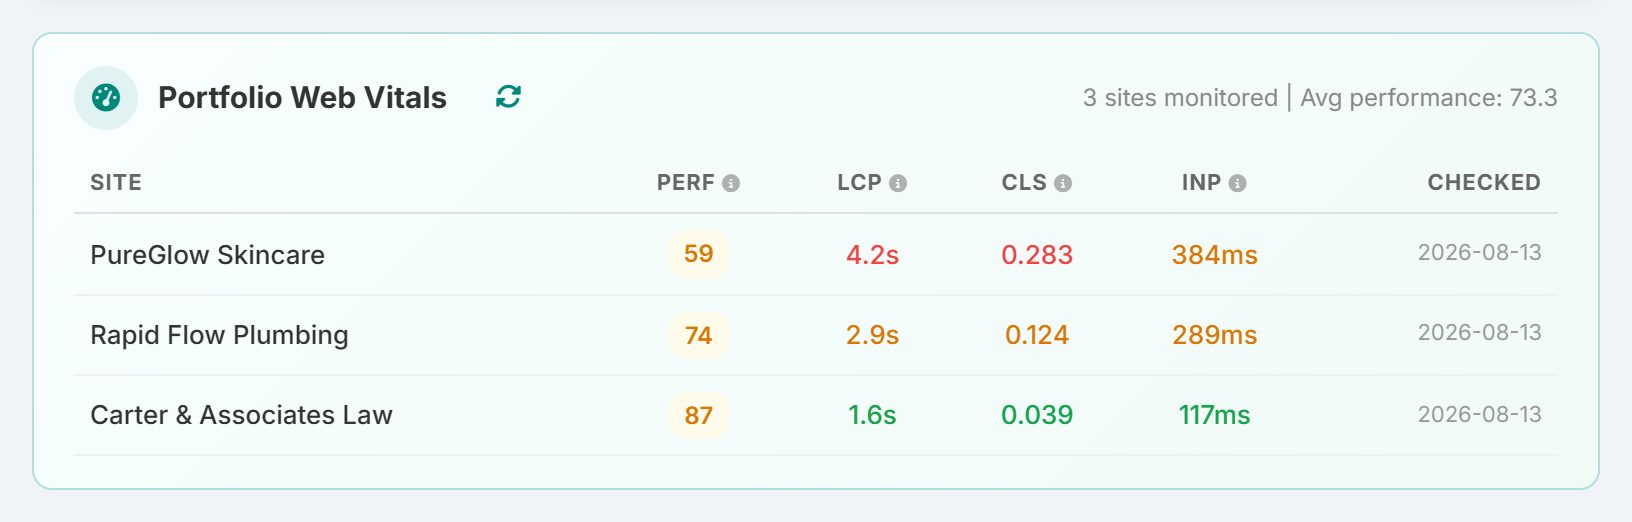
- Colors: green 90+, orange 50–89, red under 50
- Red arrow: the score dropped more than 5 points since the last check
- Automatic checks run every Sunday, so Monday morning is when problems surface
- Refresh arrow: runs a fresh check on every site right now, in the background. It's free and doesn't use Data Credits.
- A site that's never been checked won't appear. Run its first check from the site's Technical SEO tab.
5. Site cards
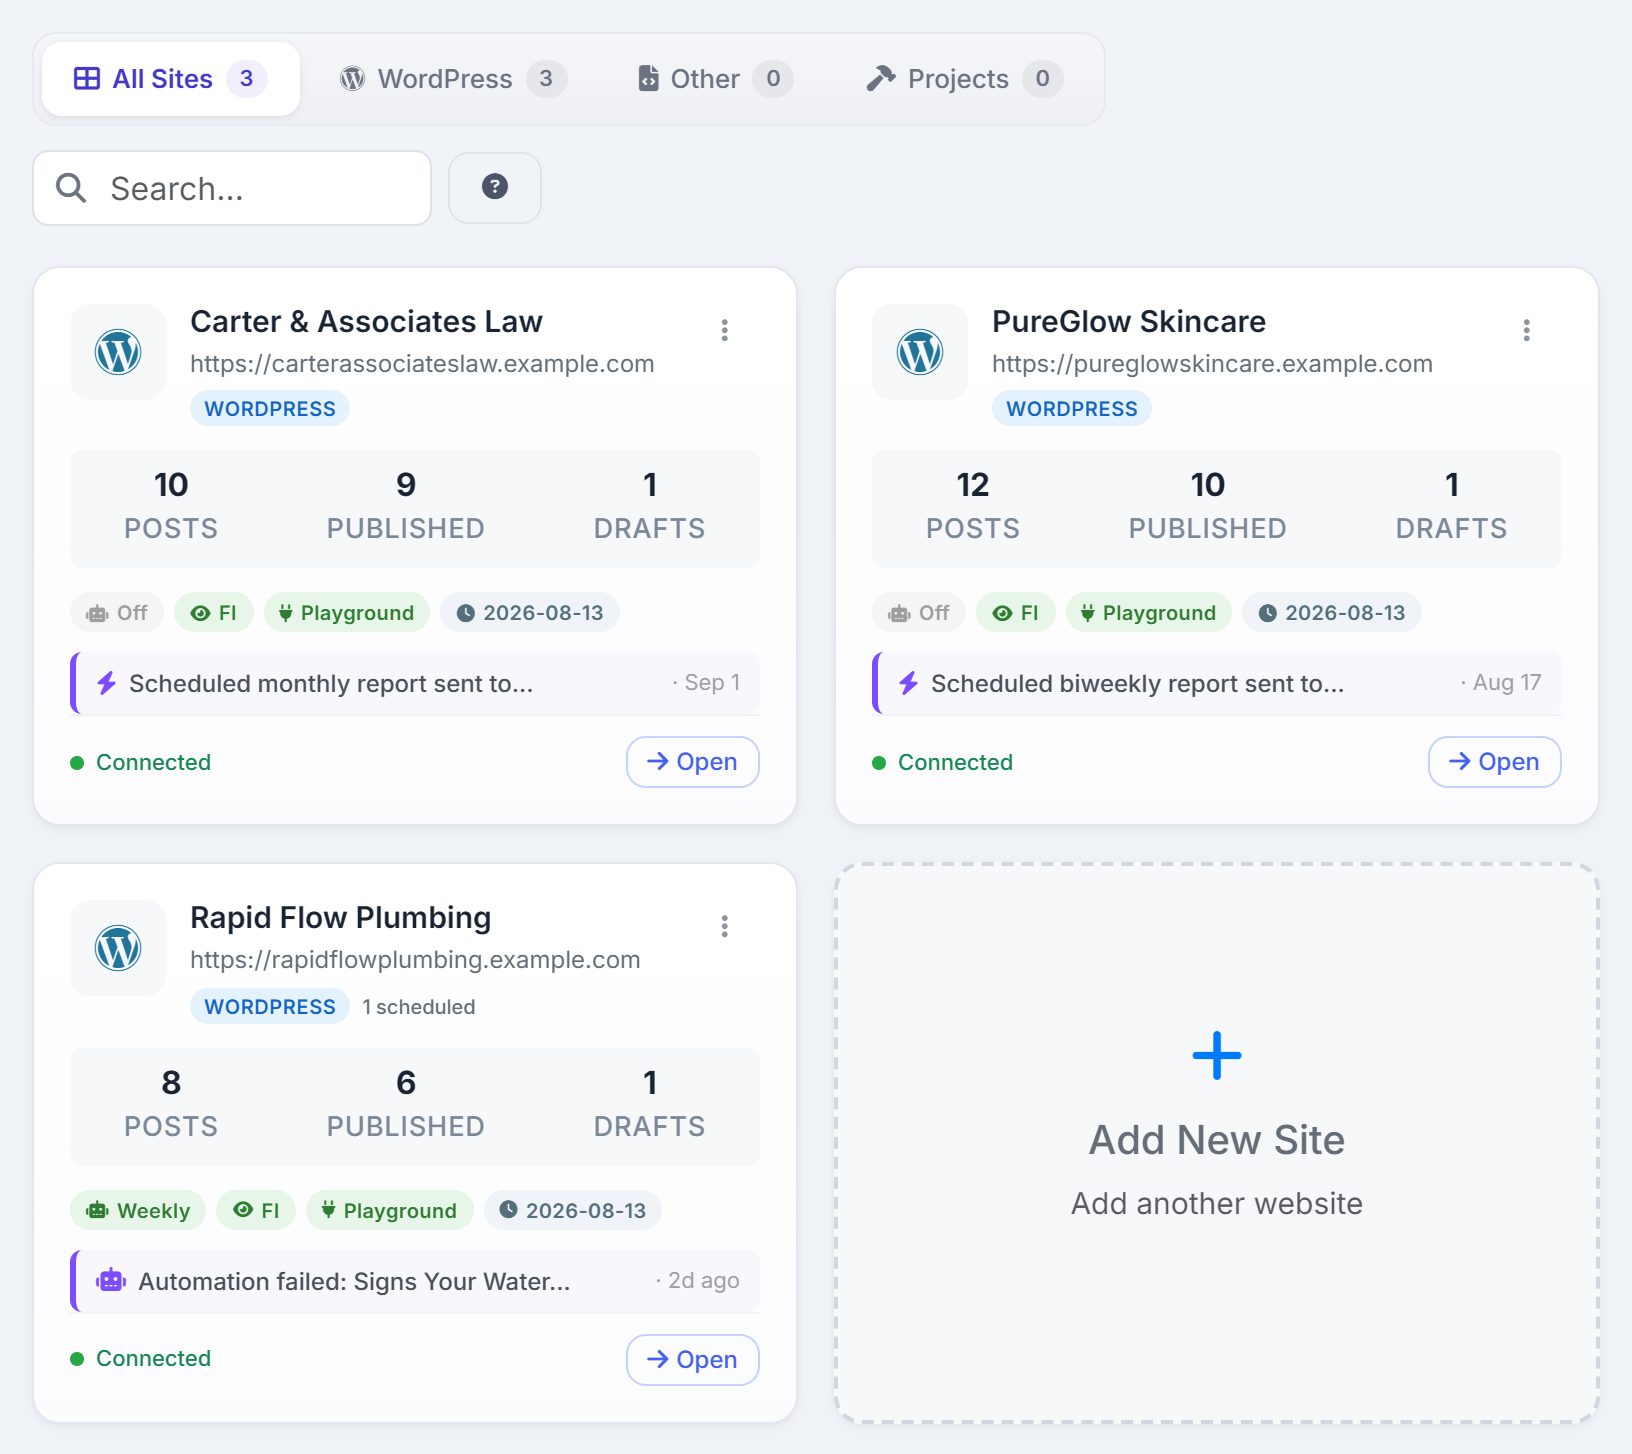
One card per client site, plus an Add New Site card at the end. Filter with the tabs (All Sites, WordPress, Other, Projects) or search by name or URL. Each card shows what's published, what's connected, and the last thing that happened. Open takes you inside the site.
Site cards get their own lesson: Sites.
Real-world example: Monday morning, 8 clients
It's Monday at 8am. You open AlmaSEO:
- The banner says "5 strategy tasks due this week (2 overdue)." You expand it. Both overdue tasks belong to Bob's Gardening. That's your first stop today.
- Portfolio Web Vitals shows Bob's Gardening dropped from 88 to 61, with a red arrow. Sunday's check caught it. You open Bob's Technical SEO tab and find the homepage LCP jumped to 4.8 seconds. Bob's nephew uploaded a 6MB photo last week. A 10-minute fix, found before Bob noticed.
- Business Overview, on the 20th of the month, shows Bob's Gardening under Thinnest Margin: the retainer covers 10 hours and you've logged 14. That's a conversation to have about scope before next month.
Three minutes on one screen, and you know exactly what your week looks like.
Key takeaways
- The Dashboard is a triage screen, not a report. It tells you where to look, not what's wrong.
- Panels hide when there's nothing to say, so anything that shows up deserves attention.
- Set a Monthly Fee (and ideally Monthly Hours) for every retainer client, or Business Overview will understate your business.
- Check Portfolio Web Vitals on Mondays, right after the Sunday scan.
- Connect Google Search Console early. Much of AlmaSEO depends on it.
Running more than a handful of clients from this screen is what an SEO dashboard for agencies is for; the next lesson, Sites, is about what happens once you click into one.